Validation data
This chapter contains useful references for extracting data about the lift and drag on different wind propulsion devices, that, for instance, can be used to validate a simulation setup. The most relevant comparison data are from methods that can be considered to be higher fidelity than the methods in Stormbird. In other words, the articles below mostly contain data from either CFD, experiments, or some type of processing of full-scale measurements.
Wing sails
Relevant papers
- Comparison of full 3D-RANS simulations with 2D-RANS/lifting line method calculations for the flow analysis of rigid wings for high performance multihulls (2014), by K. Graf and more. Paper that contains experimental results for a single element wing sail and CFD results for a two-element wingsail.
- Rapid aerodynamic method for predicting the performance of interacting wing sails (2023) by K. Malmek and more. Paper about a lifting line method for wind propulsion devices, that also contains CFD data for validation purposes. The CFD results are particularly useful for validating interaction effects.
- Wind Tunnel Tests of a Two-Element Wingsail with Focus on Near-Stall Aerodynamics (2024), by A. Hillenbrand and more. A paper about an experimental study of a two-element wing sail, with particular focus on how the stall angle is dependent on dynamic situations.
Rotor sails
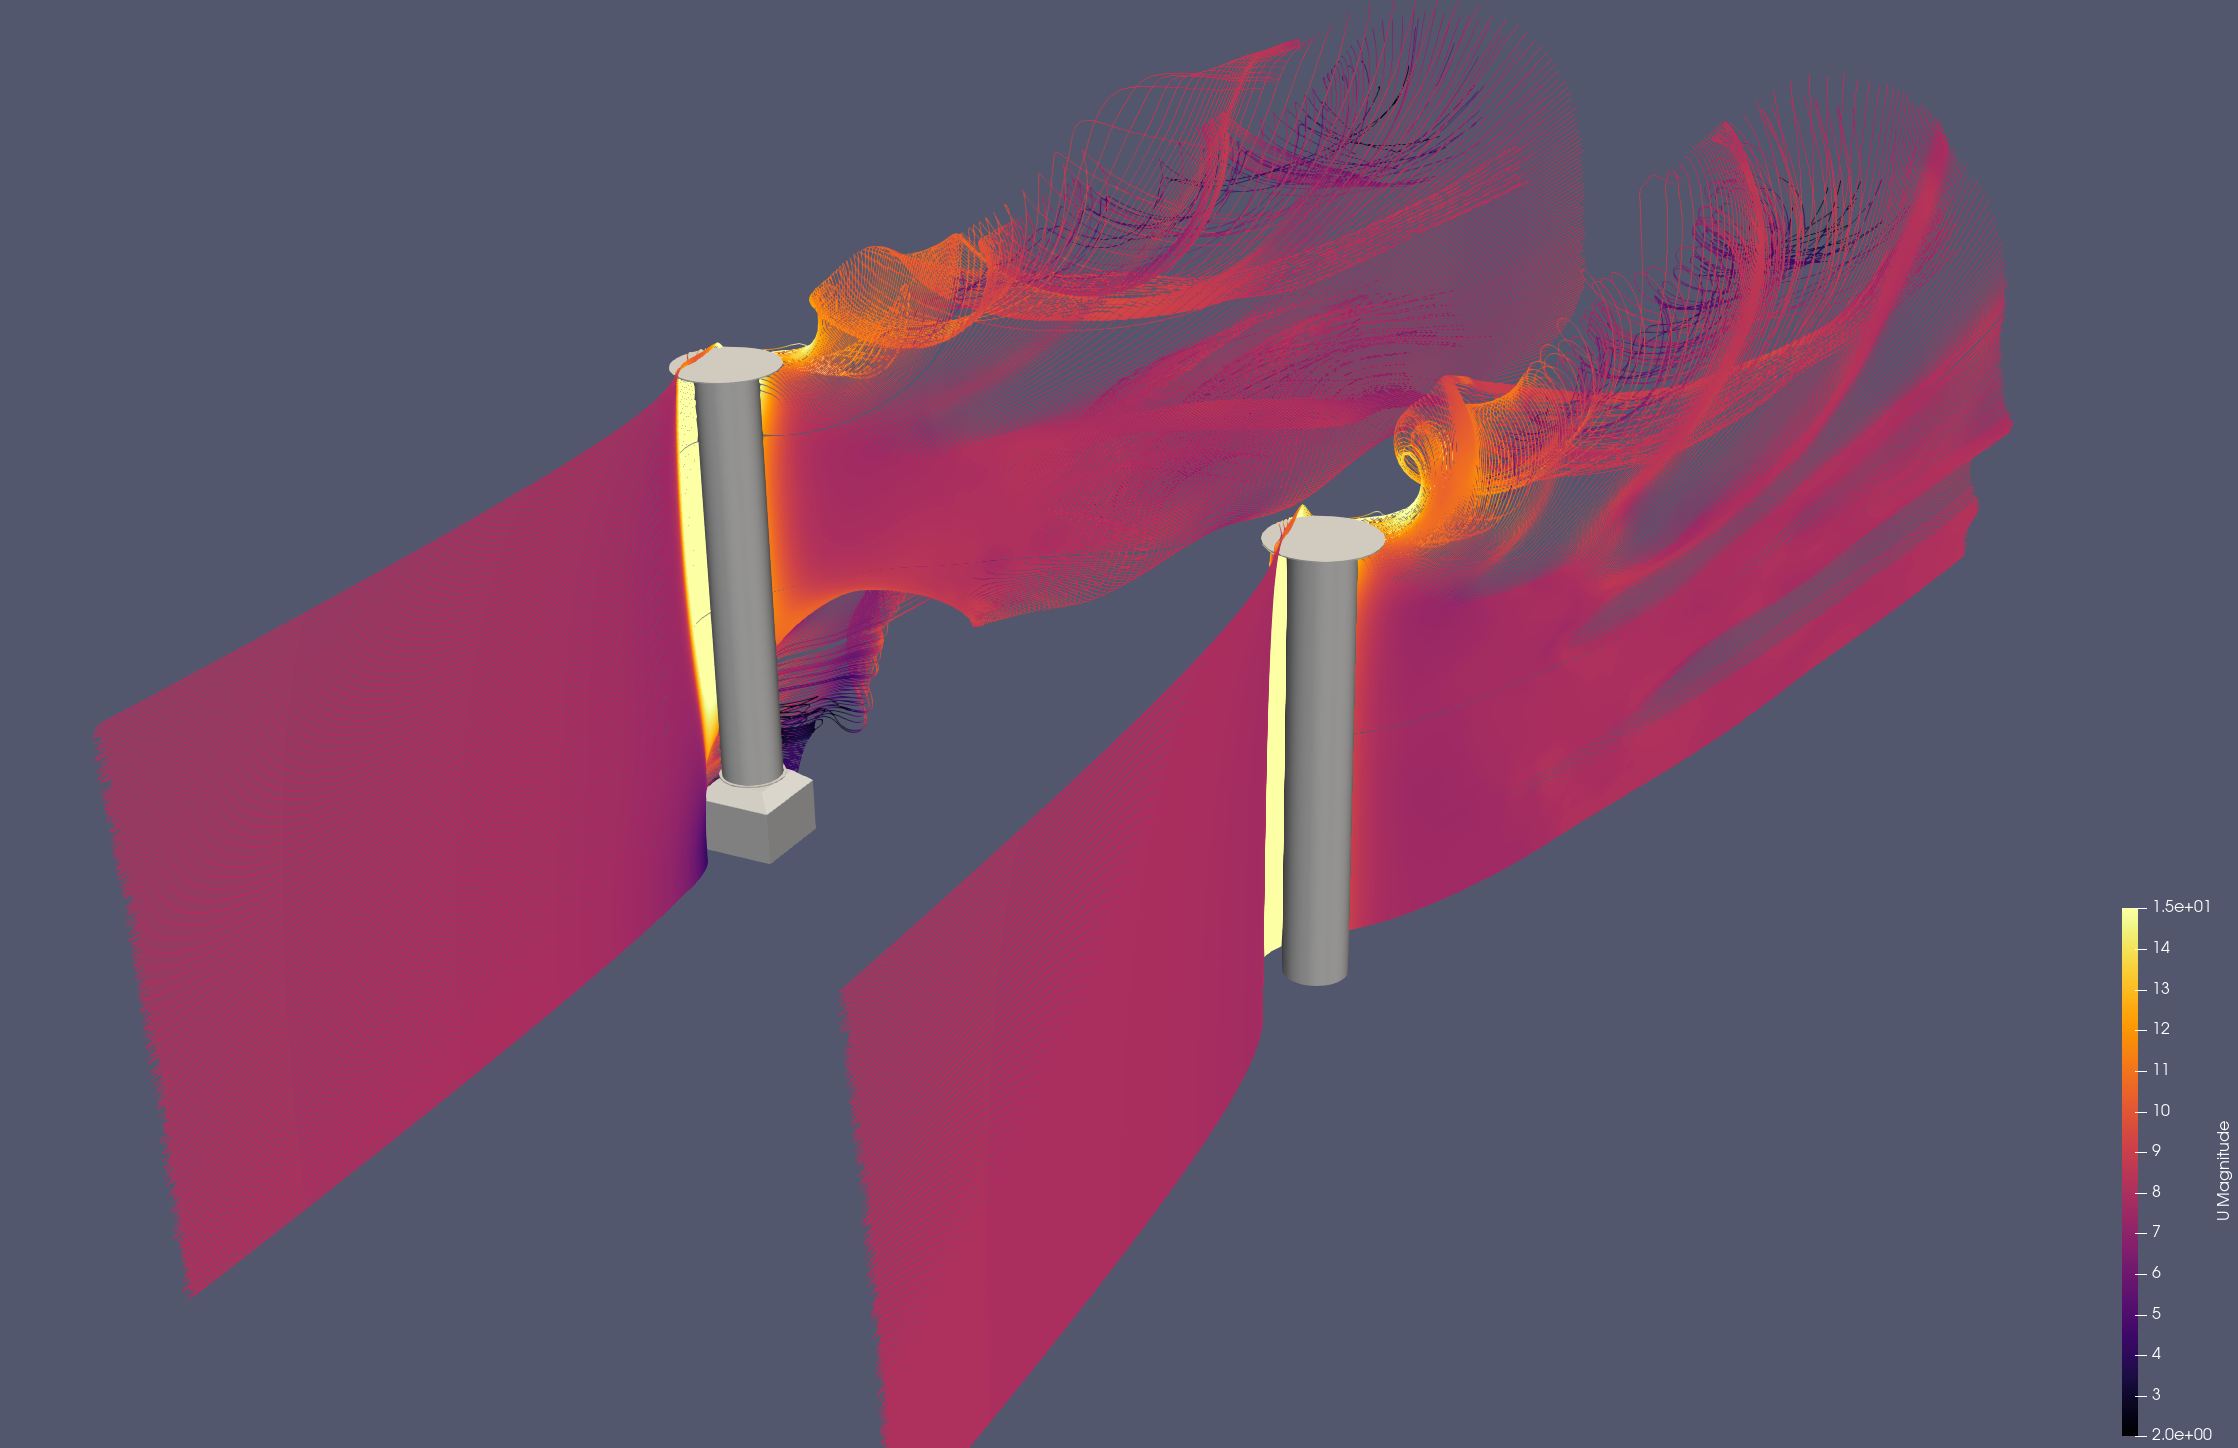
The flow around rotor sails is defined by very high lift coefficients and therefore strong tip vortices. They often come with end-plates to specifically reduce the tip losses, and thereby increase lift and reduce drag forces. CFD simulations done on rotor sails in the KSP WIND project indicate that the exact features of the tip-geometry can have large impact on the final results. For instance, the foundation geometry can have a large impact on the forces. These types of geometric details will not be part of a simplified line model of a rotor sail directly. As such, it is generally necessary to tune the models to achieve the right combination of lift and drag.
Tuning the lift can generally be done by adjusting the lift parameters in the sectional model, as the 3D lift is generally very close to the 2D lift for a rotor sail. This is because the lift is not dependent on the angle of attack, in the same way as for a wing sail or suction sail.
The recommended practice when modeling rotor sails is to first adjust the model of a single sail by comparing it to some high-fidelity data source, and then use the Stormbird library when, for instance, interaction effects are of interest.
Relevant papers
- Application of the Magnus effect to the wind propulsion of ships (1926), by L. Prandtl. One of the first papers about rotor sails. The text mainly consists of a general discussion about the concept and the history of the first ship using rotor sails for propulsion, namely The Buckau. However, there are also results from one of the first experiments of rotor sails in the appendix of the paper.
- Experiments on a Flettner rotor at critical and supercritical Reynolds numbers (2019), by G. Bordogna and more. Contains results from experiments where lift, drag and power coefficients on rotor sails were measured at different Reynolds numbers and spin ratios. Note: the experiments are performed in a wind tunnel where the rotor extends from the floor to the roof, which indicate that the force measurements should be interpreted as two-dimensional. However, it is mentioned in the article that there might be three-dimensional effects due to the boundary layer along the walls. The measured drag is also so large that there seem to be some three-dimensional effects present. The results are therefore probably most useful as a comparison for lift and power, while the drag values are a bit hard to interpret.
- Design, operation and analysis of wind-assisted cargo ships (2020), by F. Tillig and more. A paper about methods to set up empirical modeling of wind powered ships. One of the empirical methods presented is for the lift, drag and power consumption of rotor sails, tuned based on full-scale measurements.
- Retrofitting of Flettner Rotors – Results From Sea Trials of the General Cargo Ship “Fehn Pollux (2020), by M. Vahs. A paper that really is about how to analyze sea-trial data from a ship equipped with rotor sails. A part of the paper also contains wind tunnel measurements that originates from a bachelor thesis (original source not found), which gives lift and drag as a function of spin ratio.
- Levelling the Playing Field: A Numerical Platform for the Fair Comparison of Wind Propulsion Systems (2022), by F. C. Gerhardt and more. A paper mostly about the need to have independent analysis of wind propulsion devices. As part of explaining the rotor sail models, CFD results of lift and drag as a function of spin ratio are presented. This presentation also includes a comparison against other available data sources.
- Calculation of Flettner rotor forces using lifting line and CFD methods (2023), by A. Östman and more. A paper that compares lifting line simulations against CFD simulations for rotor sails. As part of this, there is both two- and three-dimensional data for lift and drag. The default parameters in the rotating cylinder sectional model in Stormbird are fitted to the two-dimensional data from this paper.
- Aerodynamics of the Flettner rotor at high Reynolds number (2024), by F. Deybach and more. Note: not yet publicly available. Part of the RINA conference on wind propulsion in 2024. Contains experimental results, where a rotor sail is tested in a wind tunnel at different Reynolds numbers and spin ratios, as well as with different end plate configurations. Concludes that the lift is not very sensitive to the Reynolds number.
Other data sources
The KSP WIND project (the project funding the development of Stormbird) has performed CFD simulations of rotor sails as part of the project. These data are not yet published anywhere, except shown in the plots below. The primary goal of these simulations was to investigate the impact of the foundation on the lift and drag. The results indicate that the foundation can have a huge impact on the forces. A model that does not include the tip vortex on the bottom of the sails can, therefore, be overly optimistic.
Plot of data
Three dimensional data
Two-dimensional data
Suction sails
For suction sails there are two aspects to the model that needs tuning. The first is to find good sectional model properties to represent how lift and drag depends on the angle of attack as a function of the fan system settings. This process is largely the same as when tuning a model for a wing sail. The only difference would be that the internal state of the section model changes from a flap angle to typically a non-dimensional suction rate (power coefficient can also be used, but this is a simplification). The second part of the model, which is new, is to find a good correlation between suction rate and power consumed. The last part is typically more challenging to get exact based on published data alone. Below is a list of papers that present some data on the properties of suction sail, although with most focus on the lift and drag, and not really the power consumption.
Relevant papers
- Fondation Cousteau and windship propulsion - 1980 - 1985 - System Cousteau - Pechiney (1985), by B. Charrier and more. A paper about the original suction sail concept, known as turbo sails. Part of the presentation is lift and drag data from the sail for different suction rates based on wind tunnel measurements.
- Wind Propulsion for Merchant Vessels (2017). A master thesis about how to model ships with wind propulsion, that also contains CFD simulations of suction sails, compared against experimental data from the original Turbosail.
- A CFD Study on Wind Assisted Propulsion Technology for Commercial Shipping (2021), by W. Hopes and more. A paper about CFD modeling of suction sails, which includes data on lift and drag.
- Levelling the Playing Field: A Numerical Platform for the Fair Comparison of Wind Propulsion Systems (2022), by F. C. Gerhardt and more. A paper mostly about the need to have independent analysis of wind propulsion devices. As part of explaining the suction sail model, CFD results of lift and drag for different suction rates and angles of attack are presented.
- Aerodynamic optimization of the eSAIL, bound4blue’s suction sail for wind-assisted vessel propulsion (2024), by A. Llopis and more. A paper about how the wind propulsion supplier bound4blue has optimized their design of a suction sail. The paper also includes both wind tunnel data and CFD data for the lift and drag as a function of angle of attack, for a few representative suction rates.
Three dimensional data
The figure below shows the lift and drag coefficients for a three-dimensional model of the Turbosail, measured in a wind tunnel for three different suction rates. The suction rate is given as a suction coefficient, \( C_Q \), defined as:
\[ C_Q = \frac{Q}{A V} \]
where \( Q \) is the volume flow through the suction system, \( A \) is the wing area and \( V \) is the wind velocity. The lift is shown as a function of angle of attack, while the drag is shown as a function of the lift. In the original figure, the drag curves for \( C_Q = 0.05 \) and \( C_Q = 0.036 \) are drawn on top of each other for most of the lift range, and are therefore identical in the digitized data.
The figure below shows the lift coefficient of the same three-dimensional sail as a function of the power coefficient, \( C_P \), defined as:
\[ C_P = \frac{P}{0.5 \rho A V^3} \]
where \( P \) is the input power to the suction system and \( \rho \) is the air density. The article does not give details about how this data was obtained, for instance at which angle of attack it applies. It should therefore mainly be seen as an example of the power consumption of a suction sail, rather than as accurate data for model tuning.
Two dimensional data
The figure below shows two-dimensional lift and drag coefficients for the Turbosail section, for a wider range of suction coefficients. As for the three-dimensional data, the lift is shown as a function of angle of attack and the drag as a function of the lift.